WEBSITE OPTIMISATION
Monitoring Web Trends in the Property Sector During COVID-19
Since the start of March this year, we have been monitoring a number of data sets to help us understand the extent the outbreak would have on online behaviour. With the outbreak causing a lockdown, industries that rely on close contact were directly hit. The property market, for example, would be one of these industries to be affected. Viewings, mortgage appointments, and removals were all on hold.
With access to a pool of website data for a number of property websites, we at Fingo have closely monitored the impact over the last 2 months.
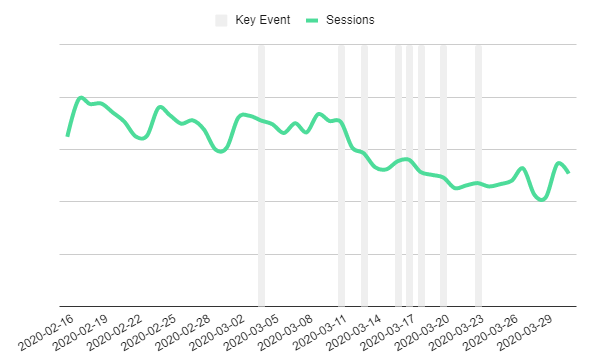
From the start, unfortunately, it was clear that the rate of decline was going to be sharp. After a global pandemic was declared by the WHO, daily traffic fell to their lowest levels since Christmas 2019. Further declines were seen after working from home was encouraged and school closures loomed.
And by the time a full lockdown was announced the impact was almost fully evident. Average daily traffic fell 30% after the outbreak had unfolded.

Daily sessions (Website visits) Across Our Property Data Set – Mid February through March
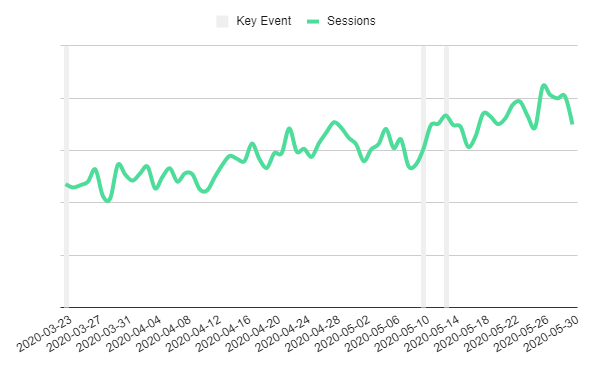
While removing the structures required to fulfil demand would inevitably reveal a fall in interest, it was apparent that the plateau was reached fairly early. Daily traffic grew steadily after people had time to process the new restrictions.

Daily sessions (Website visits )Across Our Property Data Set – Mid March through to mid-May
The gradual upturn correlated with new initiatives to bring offline experiences online such as remote viewings and video tours of properties. As it became apparent that prospect-buyers could still engage there looks to have been a slow re-emergence.
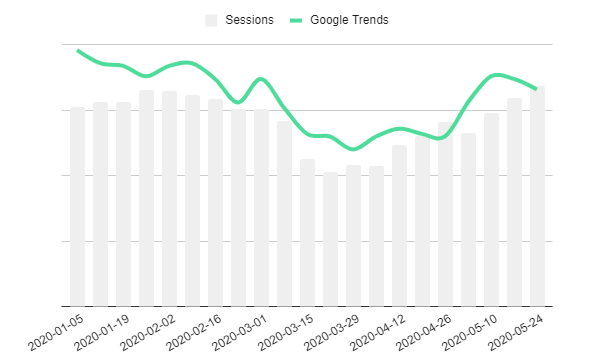
Looking at Google Trends we have seen similar results. Google Trend data is an unbiased sample of Google search data. The data is indexed to 100, where 100 is the maximum search interest for the time and location selected. A higher score out of 100 indicates that a search term or topic is being searched more often than before.
Google Trends

Weekly sessions (Website visits) Across Our Property Data Set With Google Trend Data – January to mid-May
The recent spike in Google Trend data is in response to the government announcement to ease restrictions. This sent a frenzy of media articles covering the subject which may artificially flout the actual level of consumer demand.
As per any data set, it is vulnerable to interpretation. At this level there are a number of possibilities that could be explored in making sense of the data. However, the results do show a sensitivity to the outbreak and subsequent developments. In determining how this impacts consumer needs and strategy, we would suggest exploring direct means of feedback. Talking to your audience will start to make sense of the data.
What this Means
One of the key questions still left unanswered is what type of recovery the industry will see. Daily traffic levels are not entirely reflective of how the bottom-line is performing, especially as many transactions and upcoming transactions are still in limbo or under renegotiation.
Still, the recovery in daily traffic could be a sign of upcoming or delayed interest. This does lead to some optimism but the bottom line will rest heavily on confidence and the unfolding severity of the outbreak.
Many concerns will need to be answered. Developers and agents will need to give reassurances about how viewings and consequent transactions will unfold. Success may rely more heavily on how well these solutions can be designed and portrayed.
If you’d like to learn more about user experience you can read our previous article covering it.